Upstate South Carolina Radon Map
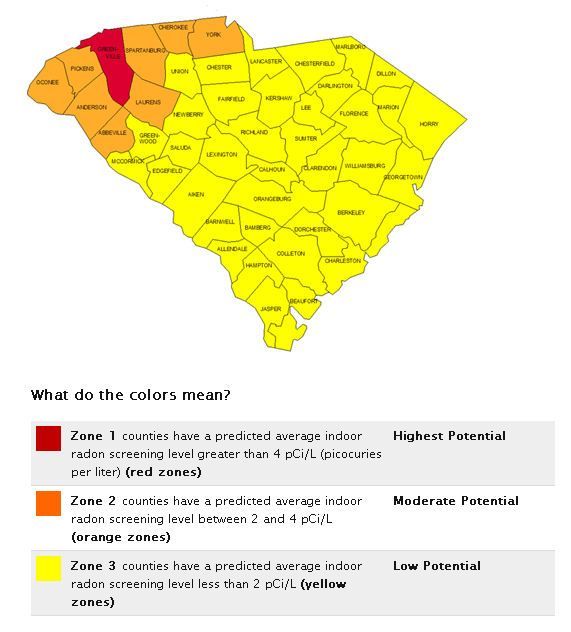
Years ago, “Zone maps” were produced the EPA that break down the country (county by county by zones) to illustrate the “potential” for radon in each county based on previous tests performed in each. Houses in Zone 1 averaged above 4 picocuries, houses in Zone 2 averaged between 2 and 4 and houses in Zone three averaged between 0 and 2. But these maps were intended to simply be a “guide”. There ARE areas of the country that have a lot HIGHER levels of radon in their homes than other parts do. But the ONLY way you are going to KNOW if your home has a problem is to get it tested.
We’ve been in the radon business since 1999. In that time period, we’ve worked with several thousand homes ALL ACROSS the SC upstate! We have fixed houses in Greenville County (Zone 1). We have fixed houses in all other upstate counties, (Zone 2) and we’ve fixed houses in Aiken and Columbia (Zone 3).


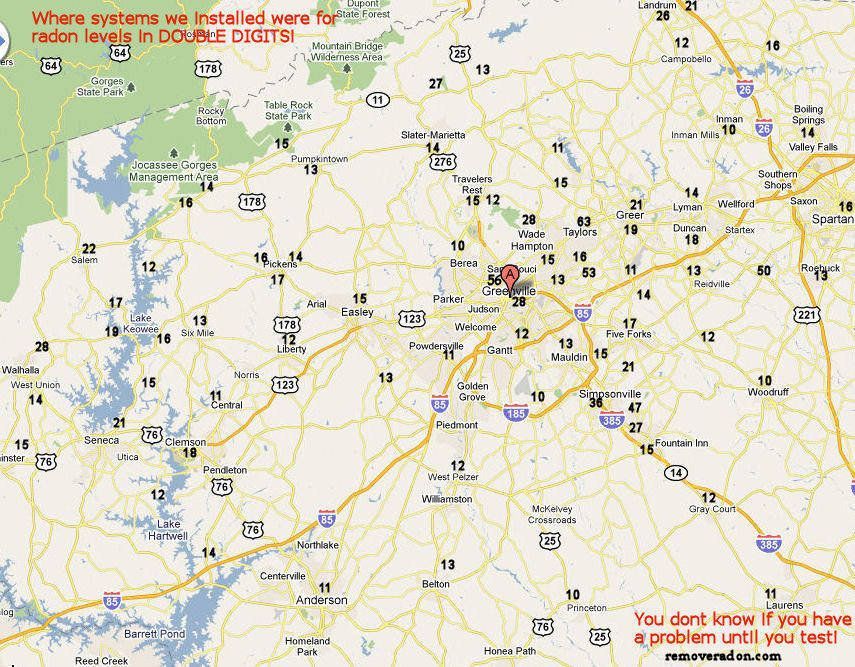
The radon levels for those homes were “all over the map” (from 4 up to 63 picocuries). Radon problems can ALWAYS be safely fixed. You just NEED to know if you have a problem.
To further illustrate how the radon levels in home can vary, we have compiled a graphic (shown below) that pinpoints a small sampling of homes we have installed radon mitigation systems in across the upstate and the radon levels that were previously obtained for each home. We include this simply to show HOW radon levels can vary from house to house and the “importance” of getting YOUR home tested using EPA accepted testing protocols.


